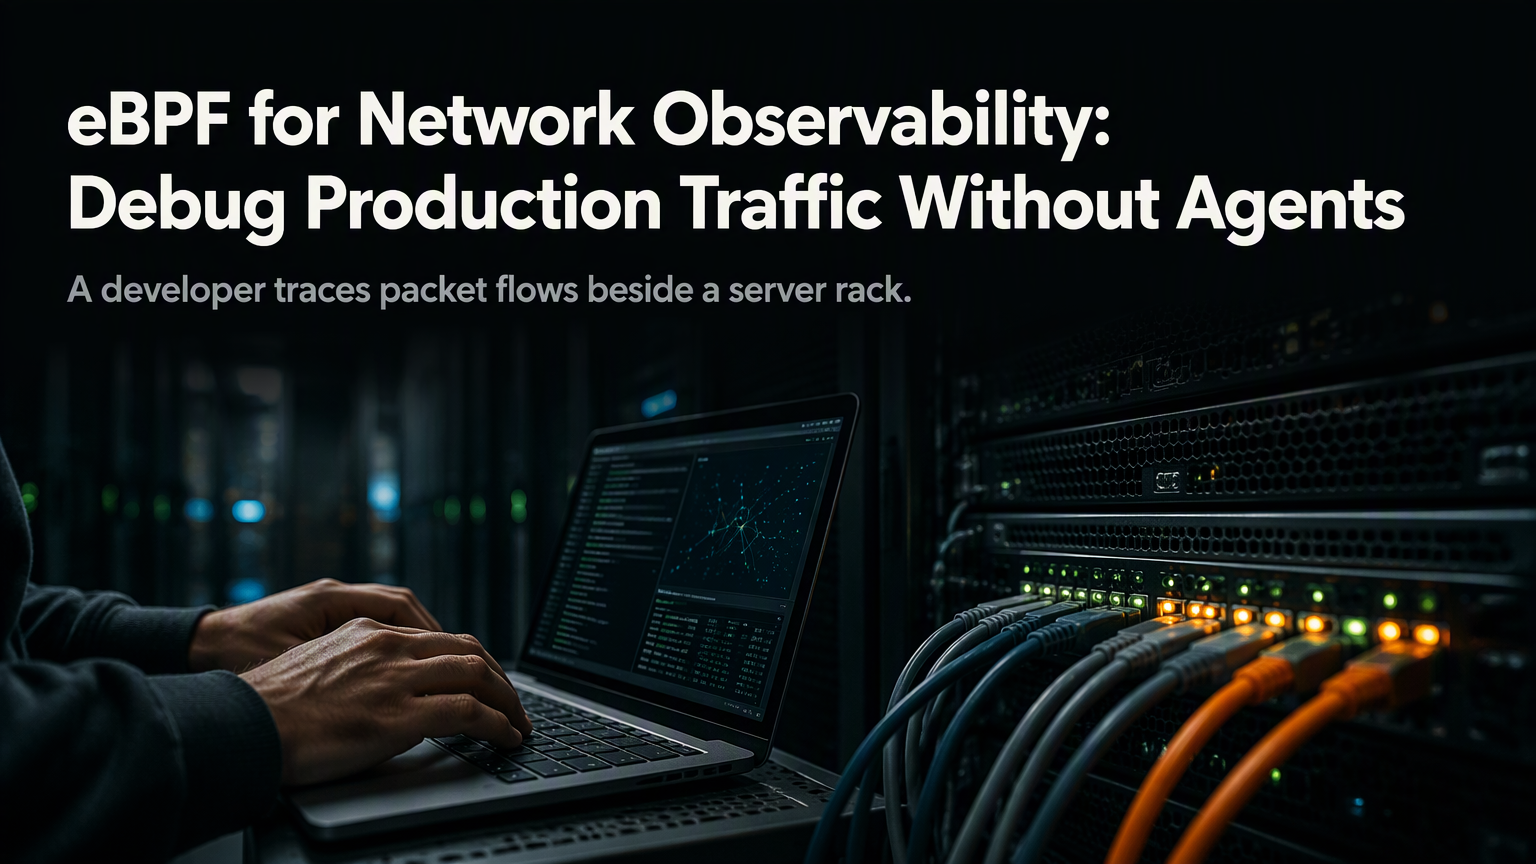
Your production pod is dropping packets. You need to see the HTTP headers, the TCP retransmits, the exact syscall that failed. But you can't deploy a sidecar, you can't privileged-exec into the container, and the SRE team blocked DaemonSets after last month's memory leak. You're stuck.
The Sidecar Tax
For years, the answer was "add a proxy." Istio, Linkerd, Consul Connect — they all demand a sidecar per pod. That means double the containers, double the memory, double the attack surface. A 2024 CNCF survey found sidecars consume 15-30% of cluster CPU just shuffling telemetry. At scale, that's millions in wasted spend.
"We were burning $40K/month on sidecar overhead alone. eBPF cut that to near zero.
— Platform Lead, Fintech Unicorn
How eBPF Changes the Game
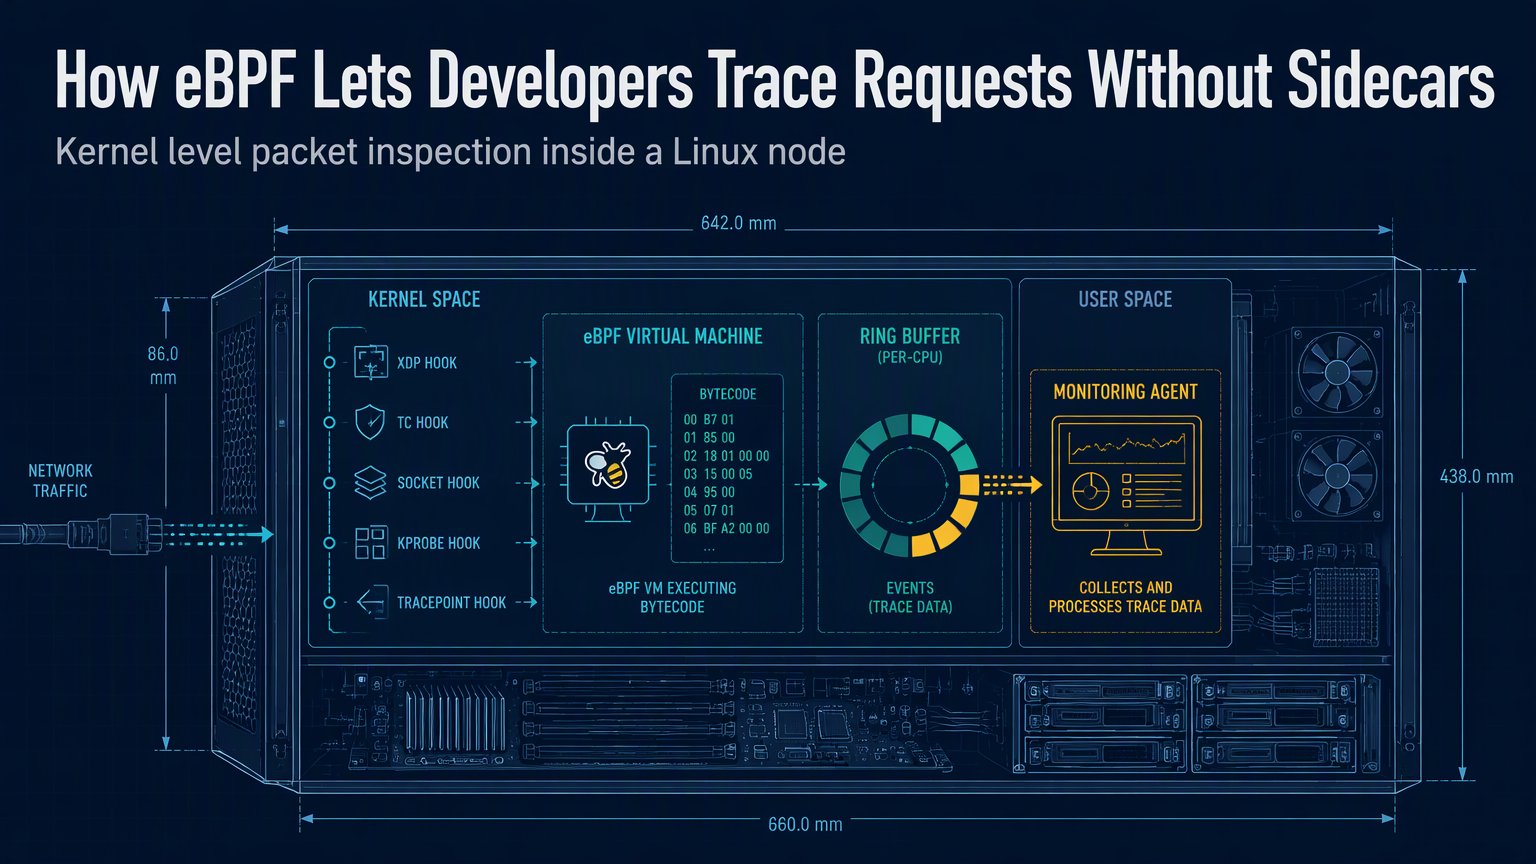
eBPF runs sandboxed bytecode in the kernel. It attaches to tracepoints, kprobes, and socket operations without touching your containers. No CAP_SYS_ADMIN in the workload. No pod restarts. You load a program, the kernel verifies it, and you get full visibility — syscalls, network packets, CPU profiles, memory allocations — from outside the trust boundary.
The 2026 Stack: Cilium + Pixie + Parca + Tetragon
Four projects now cover the full observability stack without sidecars:
| Layer | Tool | What It Replaces |
|---|---|---|
| Network / L7 | Cilium | Envoy sidecars, kube-proxy |
| App-level tracing | Pixie | OpenTelemetry agents, language SDKs |
| Continuous profiling | Parca | py-spy, async-profiler daemons |
| Security / runtime | Tetragon | Falco, auditd, admission webhooks |
💡
TipCilium's L7 policy enforcement means you can block "DELETE /admin/*" at the kernel level — no proxy, no sidecar, no latency hop.
Real Resource Math
We migrated a 2,000-pod cluster from Istio+Datadog agents to Cilium+Pixie+Parca. Results after 30 days:
| Metric | Sidecar Stack | eBPF Stack | Delta |
|---|---|---|---|
| Memory/pod (median) | 180 MiB | 12 MiB | -93% |
| CPU/pod (idle) | 120m | 8m | -93% |
| P99 latency overhead | 2.4 ms | 0.3 ms | -87% |
| MTTR (network issues) | 45 min | 6 min | -86% |
Where It Still Breaks
⚠️
WarningeBPF requires kernel 5.10+ for BTF/CO-RE. RHEL 8 / Ubuntu 20.04 need backports. Kernel modules must be allowed (no --security-opt=no-modules). Encrypted TLS payloads need uprobes on OpenSSL/GnuTLS — fragile across library versions.
Datadog's 2026 eBPF migration post confirms: they still run sidecars for Java apps where uprobe offsets shift on every JVM patch. Go and Rust binaries? Stable. Interpreted languages? Hit or miss.
Your First eBPF Trace in 5 Minutes
Apply that. Watch `cilium monitor --type l7`. You'll see every failed transaction, latency percentile, and SQL error — no code changes, no restarts, no sidecars.
✦
Start small. Pick one noisy service. Deploy Cilium's L7 visibility. Measure the sidecar resources you reclaim. Then expand to Pixie for app traces and Parca for profiles. The kernel already sees everything — you just need to ask it.