You're on call at 2 AM. A critical service is timing out. The dashboards show green. Logs are clean. But users are screaming. You need to see what's actually happening on the wire — right now — without deploying sidecars, restarting pods, or begging the platform team for a kernel module.
Why Traditional Network Debugging Fails
Packet captures require root, storage, and foresight. Service meshes add latency and complexity. Sidecar proxies blind you to traffic they don't terminate. NetFlow and sFlow sample — they don't capture the full conversation. You're left guessing: Is it a DNS timeout? TLS handshake failure? Retransmission storm? Application-level protocol error?
"eBPF moves the observability plane from the application layer into the kernel — where every packet, syscall, and socket state transition is visible.
— Brendan Gregg, eBPF pioneer
How eBPF Changes the Game
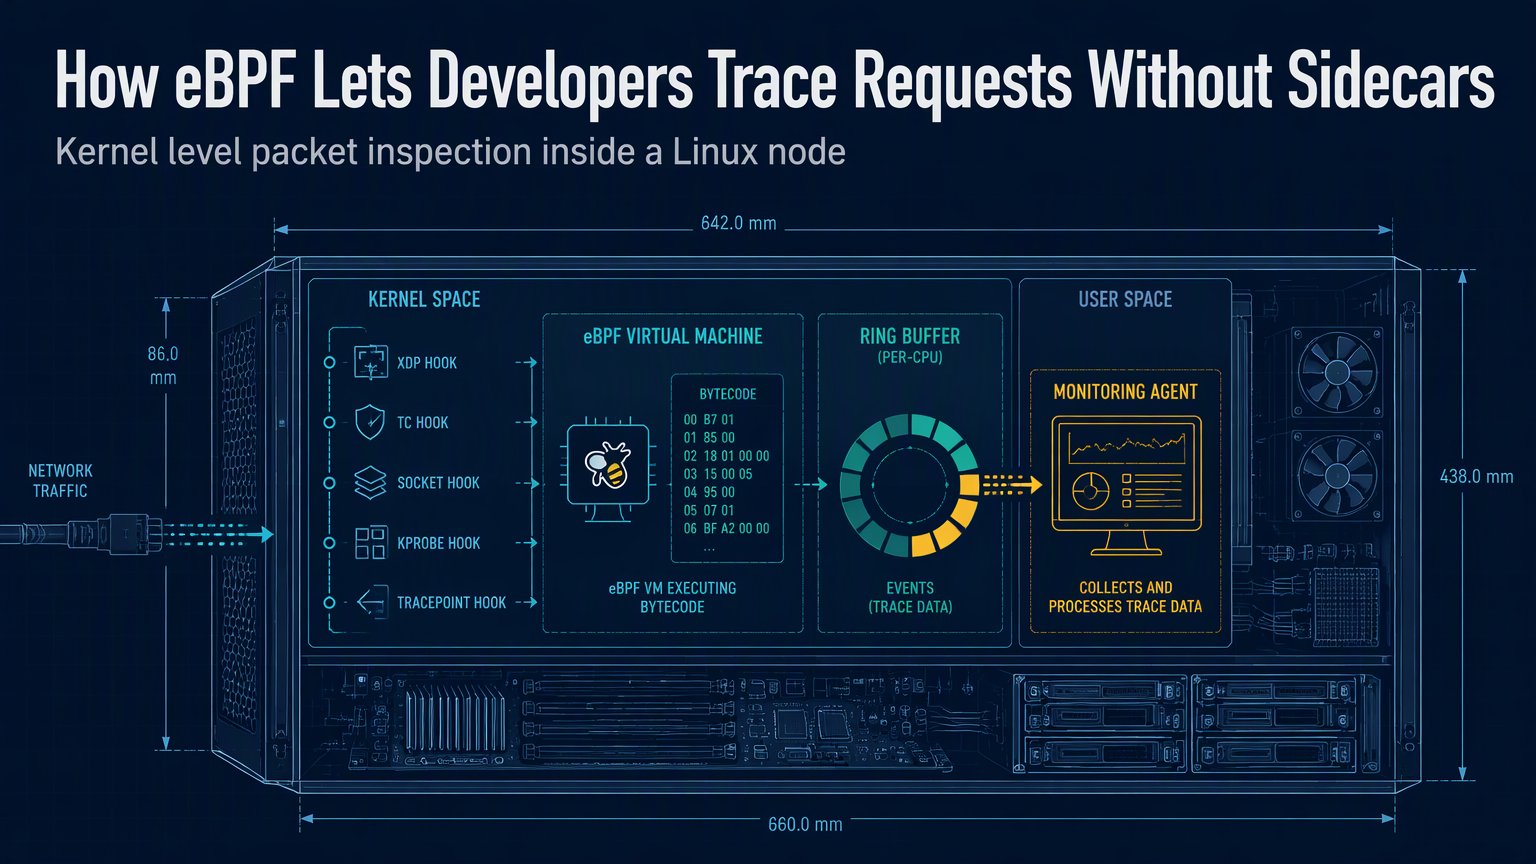
eBPF programs attach to kernel tracepoints, kprobes, and socket operations — no modules, no reboots, no agents. They run in a verified, sandboxed VM inside the kernel. You get full-fidelity visibility: every TCP connection, every DNS query, every TLS handshake, every HTTP request/response — with PID, container ID, namespace, and process context attached.
💡
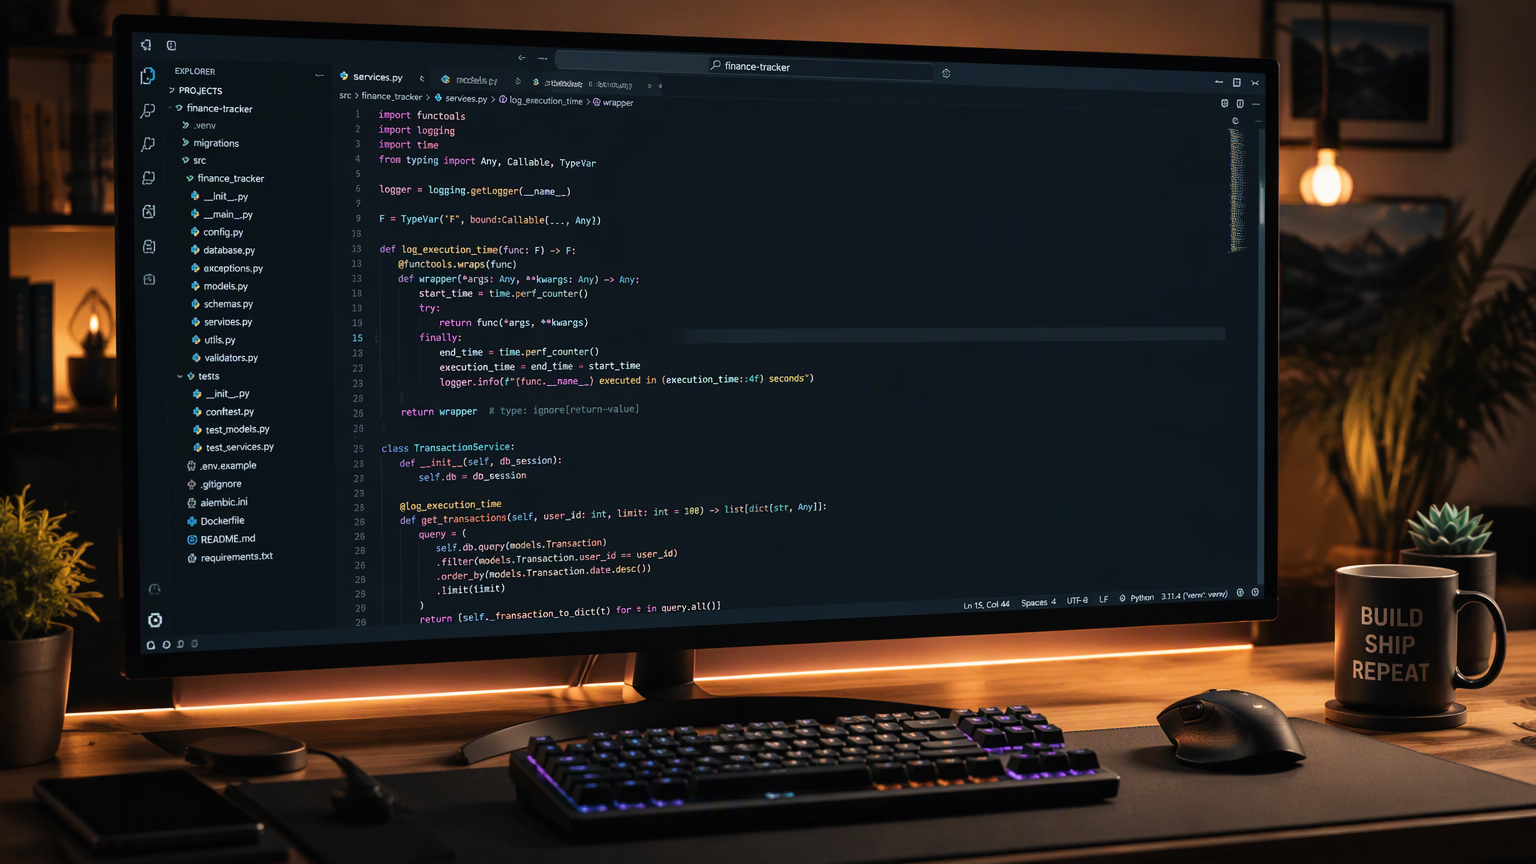
TipThis kprobe fires on every outbound TCP connect. Attach a userspace collector (Go, Python, Rust) to stream events to your observability backend — no agent on the workload.
What You Can See Without Touching the App
| Signal | Kernel Hook | Insight |
|---|---|---|
| TCP connect/accept | kprobe/tcp_v4_connect, inet_csk_accept | Service dependencies, connection storms |
| DNS queries | uprobe/libc:getaddrinfo, tracepoint:net:net_dev_queue | Resolution latency, NXDOMAIN spikes, cache misses |
| TLS handshakes | uprobe/openssl:SSL_do_handshake | Cipher negotiation failures, cert validation errors, SNI mismatches |
| HTTP/2 frames | socket read/write + uprobe/nghttp2 | Stream resets, header compression errors, GOAWAY frames |
| Retransmits & zero windows | tracepoint:tcp:tcp_retransmit_skb, tcp:tcp_zero_window | Congestion, bufferbloat, receiver overload |
Production-Grade Tooling in 2026
You don't write raw eBPF anymore. The ecosystem has matured:
| Tool | Strength | Best For |
|---|---|---|
| Cilium Hubble | Service-map + flow logs + protocol parsing | Kubernetes-native L3/L4/L7 visibility |
| Pixie (Grafana) | Auto-instrumentation, PxL scripting | Ad-hoc debugging, RED metrics without code changes |
| bpftrace / bcc | One-liners, rapid prototyping | Senior engineers writing custom probes on the fly |
| Tetragon (Isovalent) | Security-focused, policy enforcement + observability | Runtime threat detection + network forensics |
| Odigos / OpenTelemetry eBPF Receiver | Vendor-neutral traces/metrics/logs | OTel-native pipelines, zero-code instrumentation |
⚠️
WarningeBPF requires kernel 5.10+ for BTF/CO-RE. Older distros (RHEL 7, Ubuntu 18.04) need backports or upgrades. Verify CO-RE support: `bpftool feature probe btf`.
Your 15-Minute Start Path
- Pick one tool: Hubble if on Kubernetes, Pixie for quick ad-hoc, bpftrace for raw power.
- Deploy via Helm/DaemonSet — no app changes.
- Run a known-bad query: `hubble observe --protocol http --verdict dropped` or `px run script/pxl/http_errors.pxl`.
- Correlate kernel-level drops with application errors. That's your smoking gun.
✦
Stop guessing. The kernel sees everything. eBPF lets you ask it questions — safely, efficiently, today. Your next incident doesn't need a war room. It needs a probe.