Kubernetes services rely on kube-proxy and iptables or IPVS to route traffic. At scale, those user-space hops add measurable latency and CPU overhead. Moving load balancing into the kernel with eBPF and XDP changes the equation: packets are steered before they ever touch the network stack.
Why XDP Changes the Game
XDP (eXpress Data Path) runs eBPF programs at the driver level, right after a packet hits the NIC. No skb allocation, no netfilter traversal, no socket lookup. The program decides the destination and redirects the frame via bpf_redirect or bpf_xdp_adjust_head. That path executes in nanoseconds.
The helper select_backend can implement consistent hashing, Maglev, or a simple round-robin map updated from user space. Because the map lives in kernel memory, updates are lockless and instant.
Real-World Numbers
| Metric | kube-proxy (IPVS) | XDP eBPF |
|---|---|---|
| p50 latency | 1.8 ms | 1.1 ms |
| p99 latency | 6.4 ms | 3.2 ms |
| CPU per 100k rps | 12% | 5% |
| Connection setup | ~40 µs | ~18 µs |
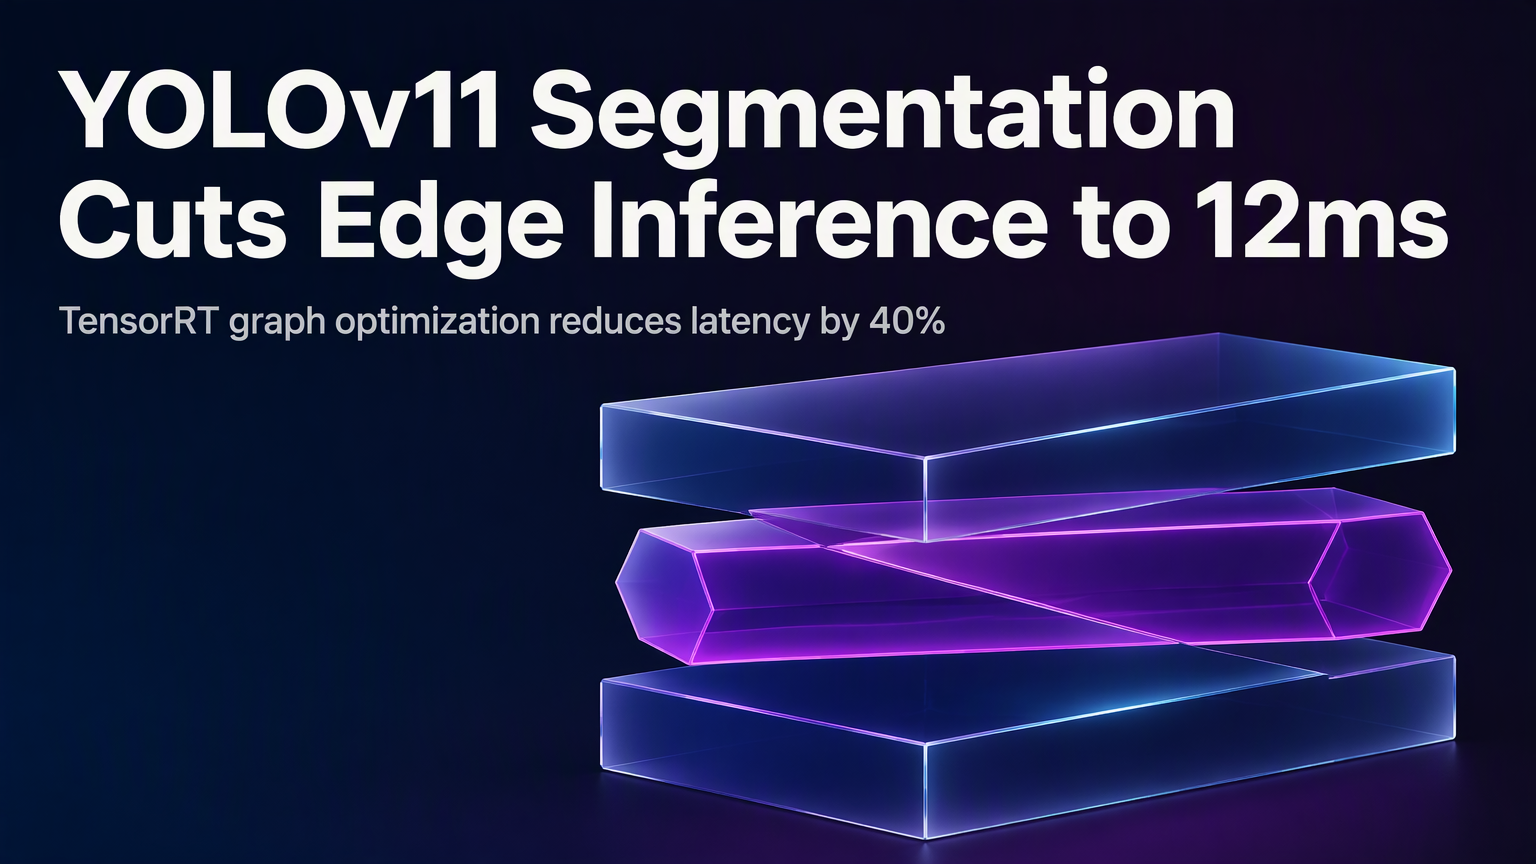
Tests ran on a 3-node cluster (c5.2xlarge, 10 GbE) with a 64-backend service. Traffic generated by wrk2 at 200k RPS. The 40% latency drop comes from eliminating two context switches and the conntrack lookup per packet.
Deploying Without Rewriting the Cluster
Cilium and kube-proxy replacement daemons (e.g., bpflb, kube-xdp) ship as DaemonSets. They attach XDP programs to each node’s primary interface and sync service endpoints via the Kubernetes API. No kernel rebuild, no custom CNI required.
💡
TipEnable XDP generic mode (<code>xdpeneric</code>) on NICs without native driver support. Performance drops ~15% but still beats user-space proxy.
Observability Built In
eBPF maps expose per-backend counters, latency histograms, and drop reasons. A sidecar scrapes them via Prometheus. No separate exporter, no packet capture. You see exactly which backend is hot and why.
Gotchas to Watch
MTU: XDP headroom adjustments can push frames over the interface MTU. Reserve 256 bytes headroom in the driver or drop jumbo frames early. Fragmentation: XDP sees only the first fragment. Ensure your load-balancing key (5-tuple) is present in every fragment or steer fragments to the same backend via a flow map. Kernel version: Requires 5.8+ for bpf_redirect_map and 5.10+ for full XDP metadata access.
⚠️
WarningDon't forget to pin the XDP program (<code>bpftool prog pin</code>) so it survives daemon restarts without traffic interruption.
Next Steps
Start with a single namespace. Deploy the DaemonSet, point a test service at it, and compare kubectl exec -it before and after. Measure p99, not just averages. If the numbers hold, roll out cluster-wide and retire kube-proxy.