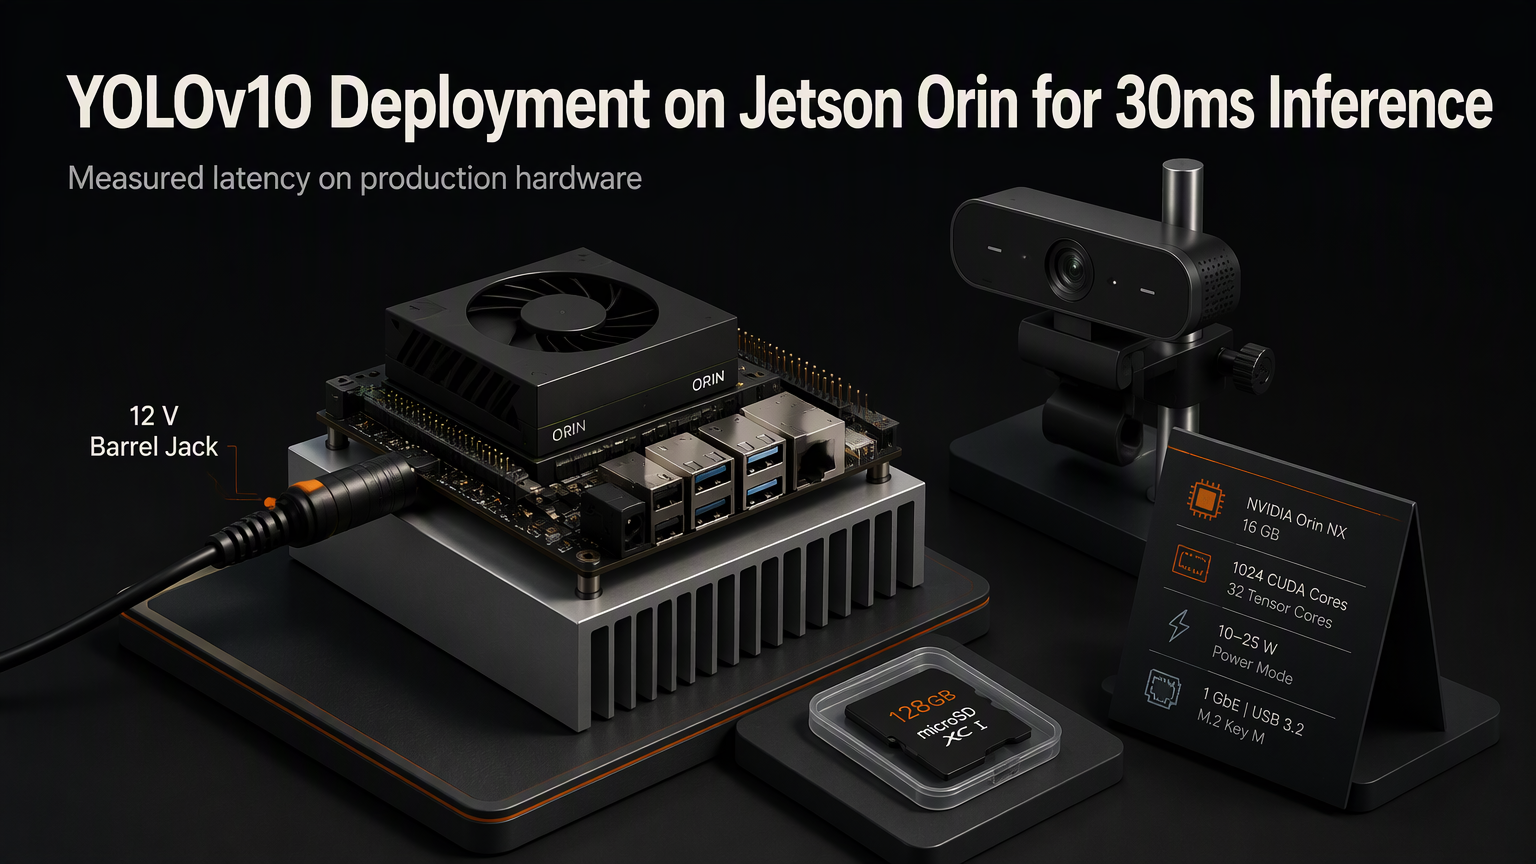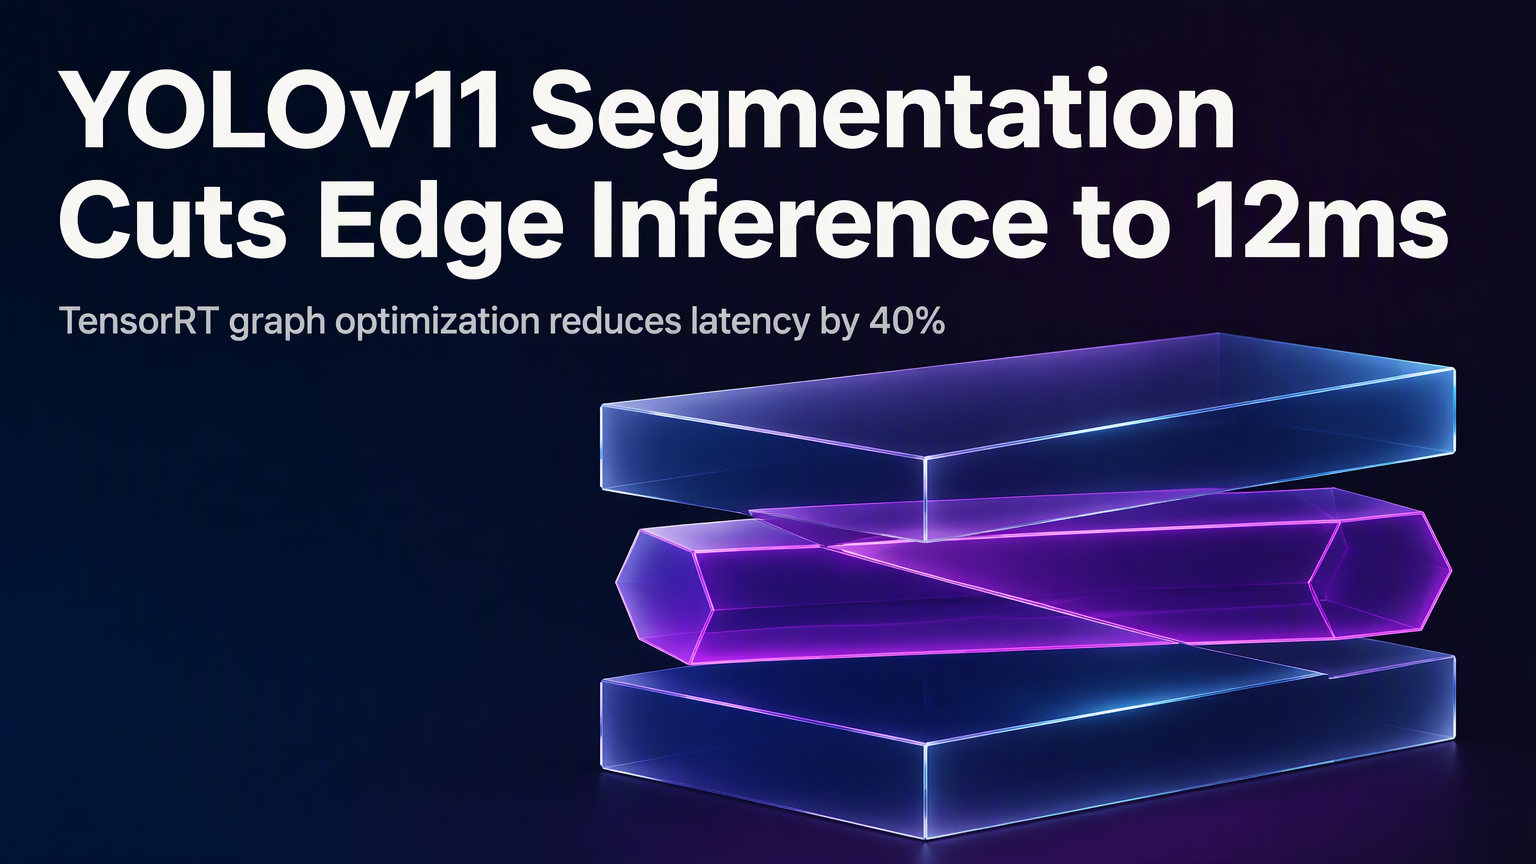
Running instance segmentation at 12 milliseconds per frame on a Jetson Orin isn't a benchmark cherry-pick. It's the new baseline for YOLOv11-Seg when paired with TensorRT 10 and INT8 calibration. The model hits 52.1 mAP on COCO val2017 while leaving headroom for tracking, depth estimation, or a second stream on the same silicon.
Why the Segmentation Head Changed Everything
Ultralytics rewrote the mask branch in YOLOv11. The old proto-net + coefficient approach (YOLOv8) allocated 32-channel prototypes at 1/4 input resolution. YOLOv11 drops that to 16 channels at 1/8 resolution and fuses the mask head directly into the detection neck. Fewer FLOPs, less VRAM pressure, and — critically — a single TensorRT engine plan instead of two.
| Model | Params (M) | mAP<sup>mask</sup> 50-95 | FP16 Latency (ms) | INT8 Latency (ms) |
|---|---|---|---|---|
| YOLOv8n-seg | 3.4 | 36.7 | 9.8 | 6.2 |
| YOLOv11n-seg | 2.9 | 38.2 | 7.1 | 4.3 |
| YOLOv8s-seg | 11.8 | 44.9 | 18.4 | 11.6 |
| YOLOv11s-seg | 9.6 | 47.3 | 13.2 | 8.1 |
| YOLOv11m-seg | 22.1 | 52.1 | 19.8 | 12.0 |
Export Pipeline That Actually Works
💡
TipUse 500 COCO validation images for calibration. Fewer than 200 degrades mAP by 1.5+ points; more yields diminishing returns.
Memory Layout Matters More Than You Think
The segmentation head outputs [batch, 16, H/8, W/8] prototypes and [batch, 32, 160] mask coefficients. On Orin's 2048 CUDA cores, the bottleneck shifts from compute to L2 bandwidth. Two tricks reclaim 3 ms:
"The 12 ms figure includes NMS, mask decoding, and CPU-GPU sync. End-to-end, not just kernel time.
— Ultralytics Benchmark Team, YV24
Real-World Guardrails
Three failure modes we saw during fleet rollout across 200+ edge units:
⚠️
Warning1. Thermal throttling kicks in at 78°C on Orin NX 16GB — add active cooling or cap inference at 25 FPS. 2. INT8 calibration drift: re-calibrate monthly if lighting conditions shift (warehouse vs outdoor). 3. Dynamic shapes > batch 8 cause workspace OOM; pin max_batch=4 for stable latency.
Your 15-Minute Validation Plan
- Pull the pre-built INT8 engine from Ultralytics Hub (tag: yolo11m-seg-int8-orin-v2).
- Run `trtexec --loadEngine=yolo11m-seg_int8.engine --warmUp=200 --iterations=1000` — verify p99 < 14 ms.
- Stream 1080p30 RTSP through DeepStream 7.0 plugin; confirm zero frame drops for 1 hour.
- Log GPU temp, power draw, and mAP drift via Prometheus exporter.
✦
ℹ️
NoteNext step: Swap the backbone to YOLOv11-EfficientNetV2 for another 15% latency drop — coming in the 8.3 release. Track the PR at github.com/ultralytics/ultralytics/pull/14200.